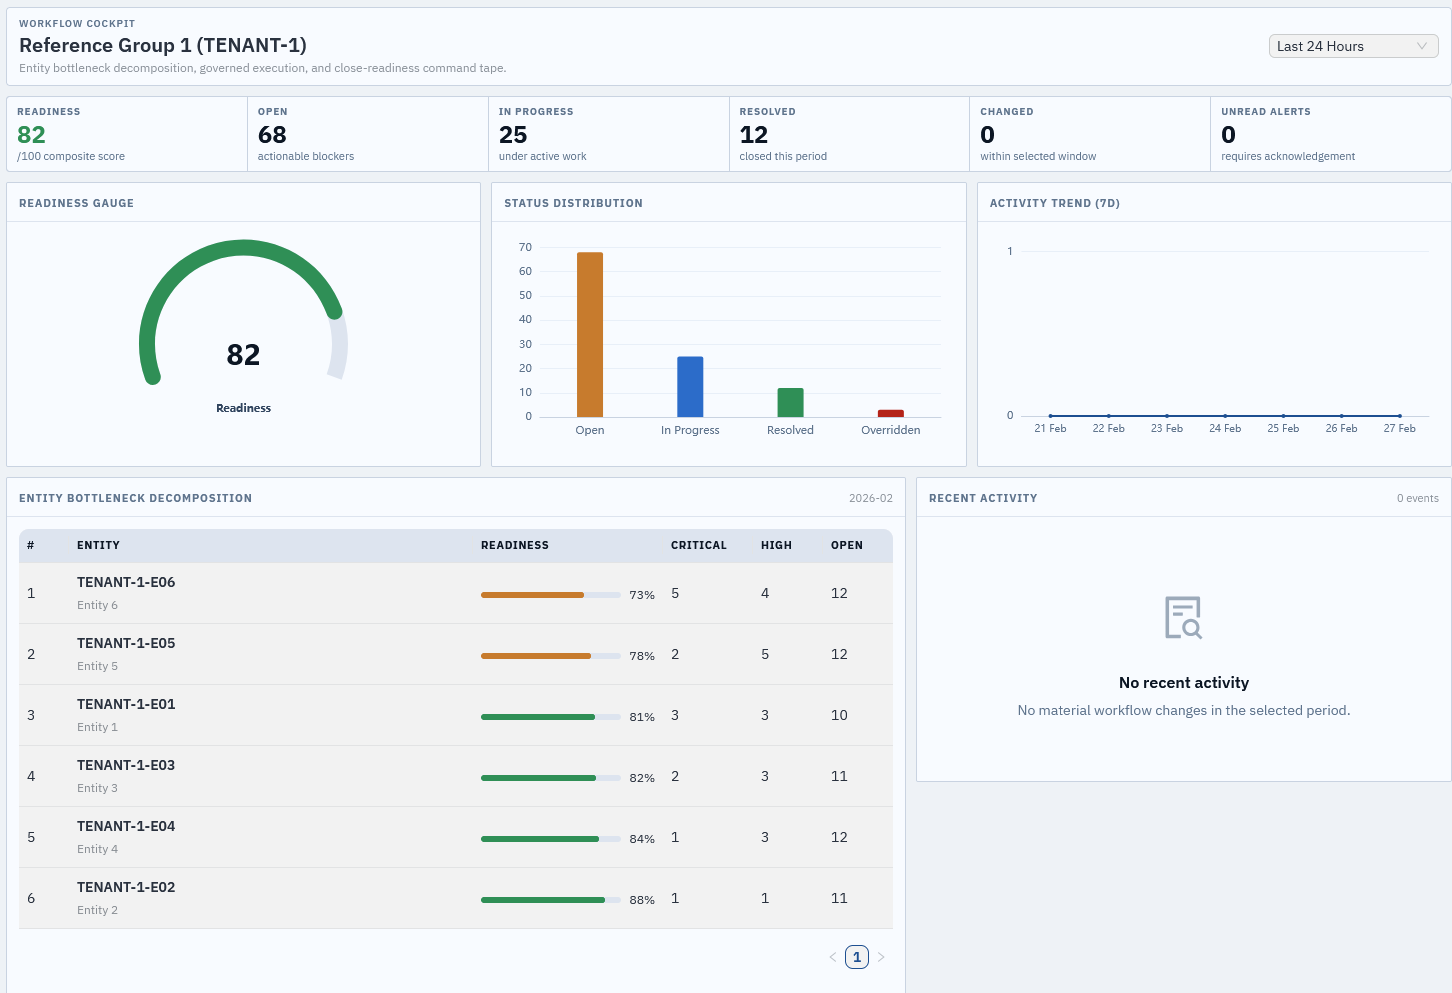
Private briefing

Book a private briefing

This is not a generic capabilities pitch. We pick one decision workflow and pressure-test whether it is controllable.

Platform snapshots

Two production control surfaces

Northstar and CloseControl show how operators move from signal to accountable decision execution.

Northstar

Workflow Cockpit

Northstar workflow cockpit showing readiness score, status distribution, and entity bottleneck decomposition.

Entity bottleneck decomposition, decision execution, and close-readiness command tape.
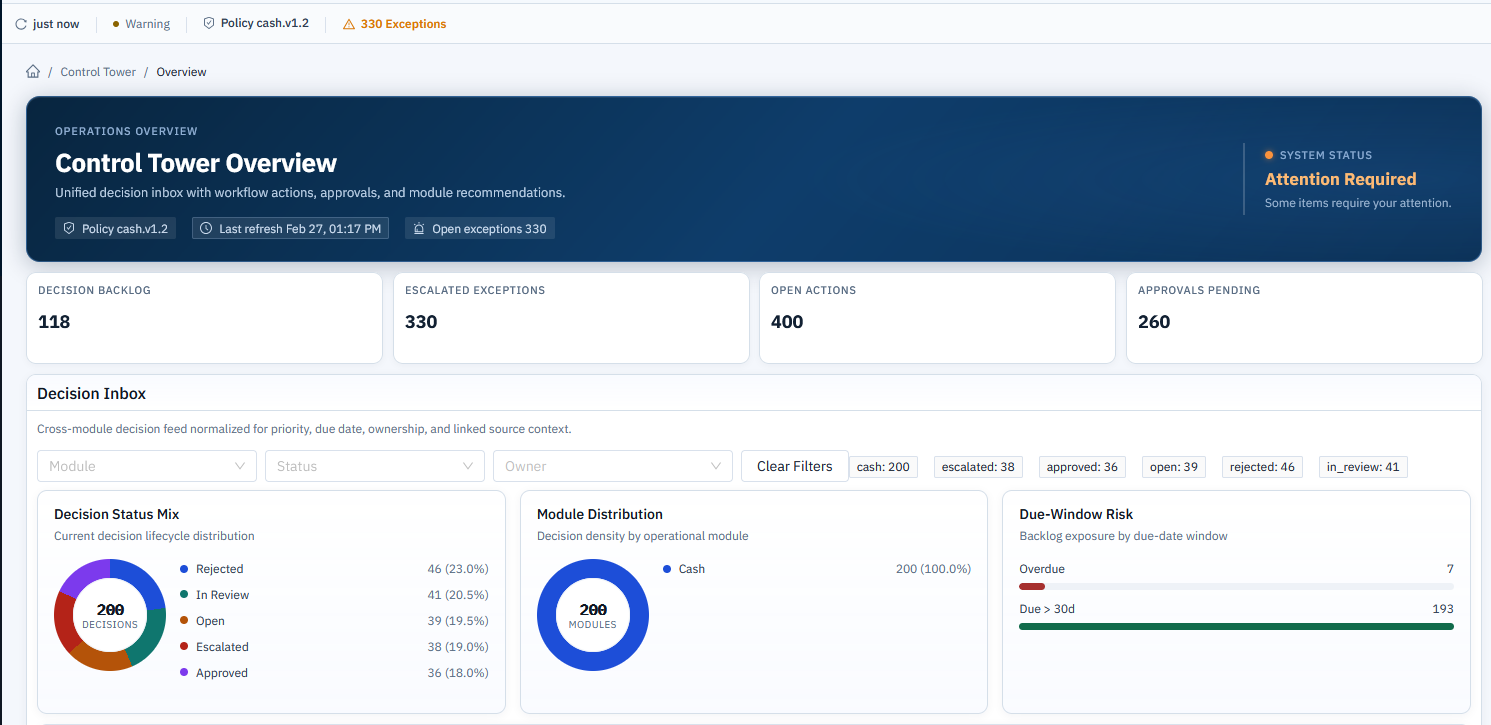
CloseControl

Control Tower

CloseControl control tower showing decision backlog, escalated exceptions, approvals pending, and due-window risk.

Unified decision inbox with escalations, approvals, due-window risk, and ownership context.

What you'll see in 20 minutes

  • Inputs -> decision list -> human approval -> audit trail.
  • How we quantify upside: pool -> conservative fixable share -> CFO-checkable math.
  • What first validation needs: optional read-only check using one minimal export.
  • How deployment works safely: read-only first, controlled write-backs only after comfort.
  • What success looks like: single owner, single metric, weekly cadence.

Who should attend

  • Day-to-day owner of the workflow.
  • One finance partner who owns the metric.

What we need to prep

  • Nothing for the first call.
  • If it's worth validating, we request one minimal export (read-only) within 48-72h.

Example engines

Engines used in private briefings

Each briefing is anchored to one workflow, one owner, and one measurable operating metric.

Efficiency Engine

Inventory and Service Level Optimizer

Inventory policy and service level decisions tied to working capital.

Decision problem

Operating teams balance service level and working capital under demand volatility.

Objective

Show how inventory policy, lead time, and supplier reliability move cost, service, and cash outcomes.

Inputs
Demand profile
  • Weekly demand mean by product class
  • Demand variability by product class
  • Replenishment cadence in weeks
Service and supply policy
  • Target service level
  • Lead time in weeks
  • Supplier reliability factor
Cost structure
  • Holding cost percent per year
  • Stockout penalty per unit
First outputs
Reorder point and safety stock

Reorder point and safety stock by product class based on service level targets.

Fill rate and backorder volume

Expected fill rate and backorder units tied to demand variability.

Holding and stockout cost

Annual holding cost and stockout exposure by class and total.

Working capital impact

Working capital tied up and released versus the baseline policy.

Revenue Engine

Pricing and Demand Optimization Simulator

Pricing decisions tied to demand response, revenue, and margin.

Decision problem

Price moves often lack clear elasticity, win rate, or capacity impact.

Objective

Quantify how price, demand response, and competitive position shift revenue and margin.

Inputs
Pricing and cost
  • Current list price and unit cost
  • Discount floor for approvals
Demand response
  • Baseline demand volume
  • Price elasticity assumption
Market and capacity
  • Competitor price index
  • Win rate sensitivity
  • Capacity constraint
First outputs
Recommended price

Price that maximizes contribution within capacity limits.

Demand and revenue

Expected demand, revenue, and gross margin at the recommended price.

Capacity utilization

Share of capacity consumed under the selected price.

Competitive sensitivity

Win rate response to competitor price shifts.

Strategic Engine

Strategic Investment Scenario Modeling

Capital allocation scenarios with probability ranges and downside risk.

Decision problem

Capital allocation decisions often rely on deterministic models that hide downside risk.

Objective

Quantify outcome distributions and compare downside protection versus upside capture.

Inputs
Portfolio allocation
  • Initial capital and allocation mix
  • Time horizon and scenario selection
Return assumptions
  • Expected returns and volatility by asset class
  • Correlation assumptions across asset classes
Simulation settings
  • Simulation count and confidence percentiles
  • Hurdle rate target and capital floor
First outputs
Outcome distribution

Probability range for portfolio outcomes with percentiles.

Downside risk metrics

Value at risk and conditional value at risk at selected confidence levels.

Risk adjusted return

Sharpe ratio and drawdown profile for each scenario.

Decision summary

Probability of meeting hurdle rates and expected downside exposure.

Capability Engine

Model Reliability and Drift Control Simulator

Model drift monitoring and retraining impact on value at risk.

Decision problem

Models decay in production without monitoring, creating value leakage and decision risk.

Objective

Show how monitoring cadence, retraining, and automation reduce drift exposure.

Inputs
Model health baseline
  • Baseline model accuracy
  • Drift rate per month
  • Data quality score
Operations and monitoring
  • Monitoring frequency in days
  • Retraining cadence in weeks
  • Automation coverage percent
Decision exposure
  • Decision volume per month
  • Cost per wrong decision
First outputs
Monthly value at risk

Expected value at risk from decision errors per month.

Detection and recovery time

Time to detect drift and restore baseline performance.

Reliability score

Score derived from accuracy stability and automation coverage.

Value protected

Estimated value preserved by improving monitoring and automation.

Move from briefing to validation

Briefings align scope and ownership, then the QOA validates measurable upside and delivery feasibility.